The Long Shutout: More Than 1 in 4 Unemployed Americans Experienced Long-Term Unemployment


Our customers have been hired at: *Foot Note


Table of Contents
Get started with MyPerfectResume today!
- Build a resume on any device
- Pick an ATS-friendly template
- Tailor with AI copy suggestions
For Americans looking for work, the wait is getting longer. Layoffs remain low, but employers are hiring at their slowest rate in the 11 years studied. Meanwhile, a growing share of unemployed workers are long-term unemployed.
A MyPerfectResume analysis of 23 federal datasets found that, on average, more than 1 in 4 unemployed Americans were long-term unemployed during the first seven months of 2026. The Bureau of Labor Statistics (BLS) defines long-term unemployment as being unemployed for 27 weeks or longer. That’s up from roughly 1 in 5 in 2023.
Participation among adults in their working years remains strong, and layoffs remain subdued. Yet unemployment is lasting longer. We call this pattern the “Long Shutout”: Prolonged unemployment is rising as hiring slows and fewer workers leave their jobs.
Fewer layoffs offer some reassurance to employed people. For those trying to find work, months without a job tell a harder story.
Key Findings
- More than 1 in 4 unemployed Americans were unemployed long-term. The share unemployed for at least 27 weeks averaged 25.9% in the first seven months of 2026, up from 18.9% in 2023.
- The long-term unemployed population has grown 68% since 2023. It rose from an average of 1.1 million in 2023 to 1.9 million in 2026.
- People are spending longer unemployed. The median duration of unemployment was about 11 weeks, and the average duration was about 25 weeks, both roughly a quarter higher than in 2023.
- Hiring is a standout weakness. The hiring rate fell to its lowest level in the 11-year period studied, while layoffs remained below pre-pandemic levels.
- Adults ages 25–54 remained active in the labor market. Their labor force participation rate reached its highest level in the study.
Long-Term Unemployment Has Climbed Every Year Since 2023
In the first seven months of 2026, an average of 1.9 million Americans had been unemployed for at least 27 weeks. That was up from 1.1 million in 2023.
The share of all unemployed people in this group also rose, reaching 25.9%. Together, the count and the share show how many people are long-term unemployed and how common prolonged unemployment has become among those out of work. The share helps distinguish an increase in long-term unemployment from an increase in the overall unemployed population.
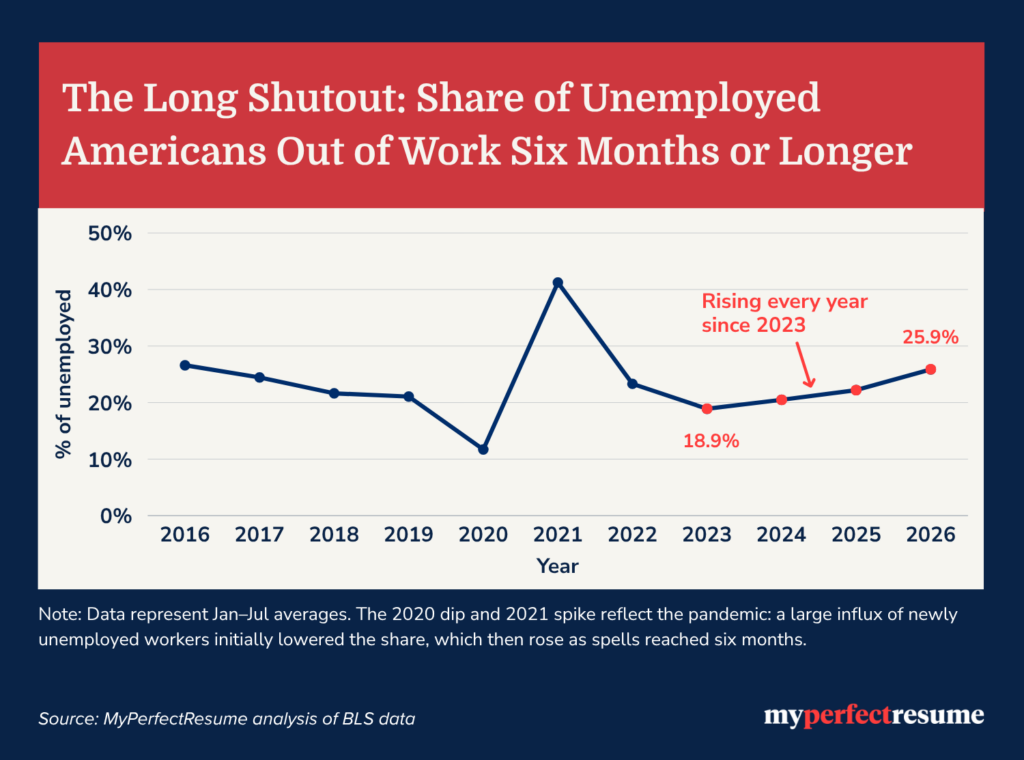
The longer-term pattern provides context:
- Before the pandemic, the share of the long-term unemployed fell from 26.6% in 2016 to 21.1% in 2019.
- During the pandemic, it initially dropped to 11.7% in 2020 as newly unemployed workers swelled the total, then rose to 41.2% in 2021 as unemployment spells lengthened.
- Since 2023, it has increased each year, rising from 18.9% to 25.9% in 2026.
May 2026 was particularly difficult. The share reached 27.5%, and the number of long-term unemployed workers reached 1,988,000. The broader trend puts long-term unemployment back near the levels seen in 2016 and 2017.
The finding doesn’t depend on choosing 2023 as the comparison year. Measured against 2019, the last full year before the pandemic, the long-term unemployed count is 46.4% higher. Measured against 2022, it’s 32% higher.
Unemployment is also lasting longer for the typical job seeker, not only for those at the extremes. Median duration rose from 8.9 weeks in 2023 to 11.1 weeks in 2026, a 24.7% increase. Average duration rose from 20.4 to 25.1 weeks. The median is the midpoint: Half of unemployed people had been out of work for less time and half for longer.
The average is more affected by people with very long periods of unemployment. Both measures describe time already spent unemployed, rather than how long a completed job search takes.
Hiring Has Slowed Even as Layoffs Remain Low
Employer data from the BLS’s Job Openings and Labor Turnover Survey (JOLTS) helps explain the backdrop to these longer unemployment periods.
| What Employers Reported (Jan–Jul Average) | 2019 | 2023 | 2026 |
| Hiring rate | 3.9% | 3.8% | 3.3% |
| Quits rate | 2.3% | 2.4% | 2% |
| Layoffs rate | 1.2% | 1.1% | 1.1% |
| Job openings rate | 4.6% | 5.8% | 4.4% |
Hiring and quits were both at their lowest rates in the period studied. Meanwhile, the layoff rate remained below that of any year from 2016 through 2019. That combination means fewer hires and fewer voluntary departures, even without a surge in layoffs. Job openings have also fallen back to their pre-pandemic range, from 5.8% in 2023 to 4.4% in 2026.
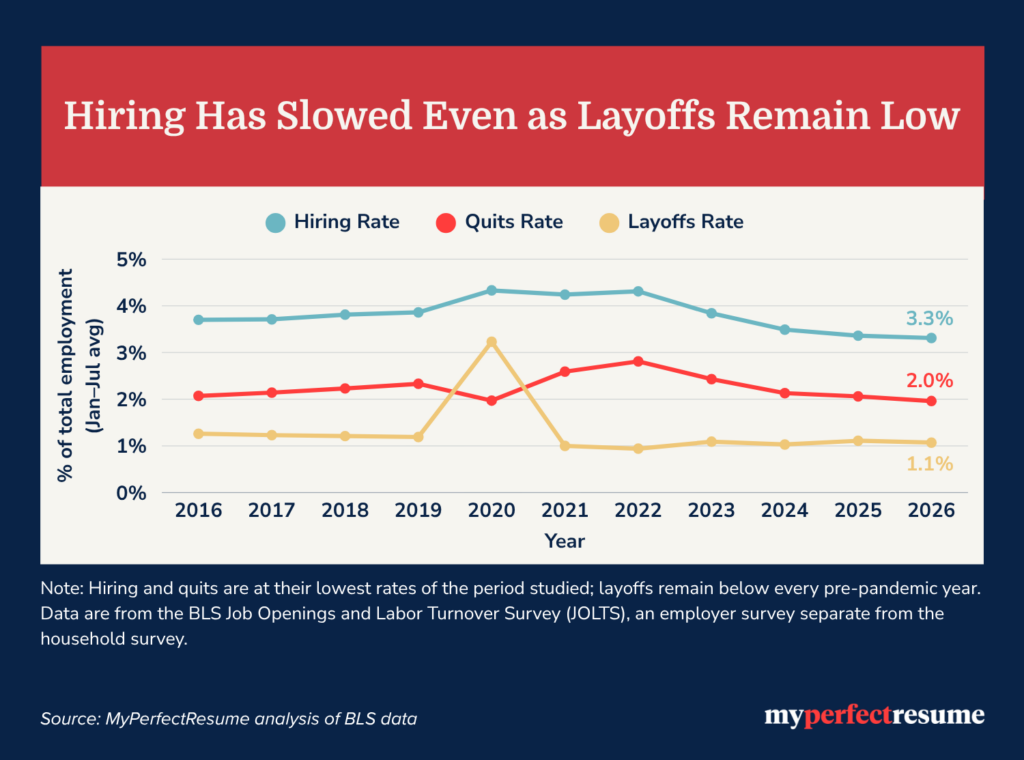
These figures have an important limitation. JOLTS counts all hires, not specifically people moving from unemployment into a job, so it doesn’t establish that weak hiring caused longer unemployment. It shows that hiring has slowed while unemployment has become more prolonged.
Adults Ages 25–54 Remain Active in the Labor Market
The participation data offers another piece of the story: adults in their main working years remain strongly engaged in the labor market.
Among adults ages 25 to 54, often called “prime age” workers, 83.7% were employed or looking for work, up 0.5 percentage points since 2023. That was the highest level in the study.
The overall rate, which includes people ages 16 and older, fell 0.8 percentage points to 61.8%. An aging population moving into retirement can contribute to that decline, although this analysis doesn’t measure how much it explains.
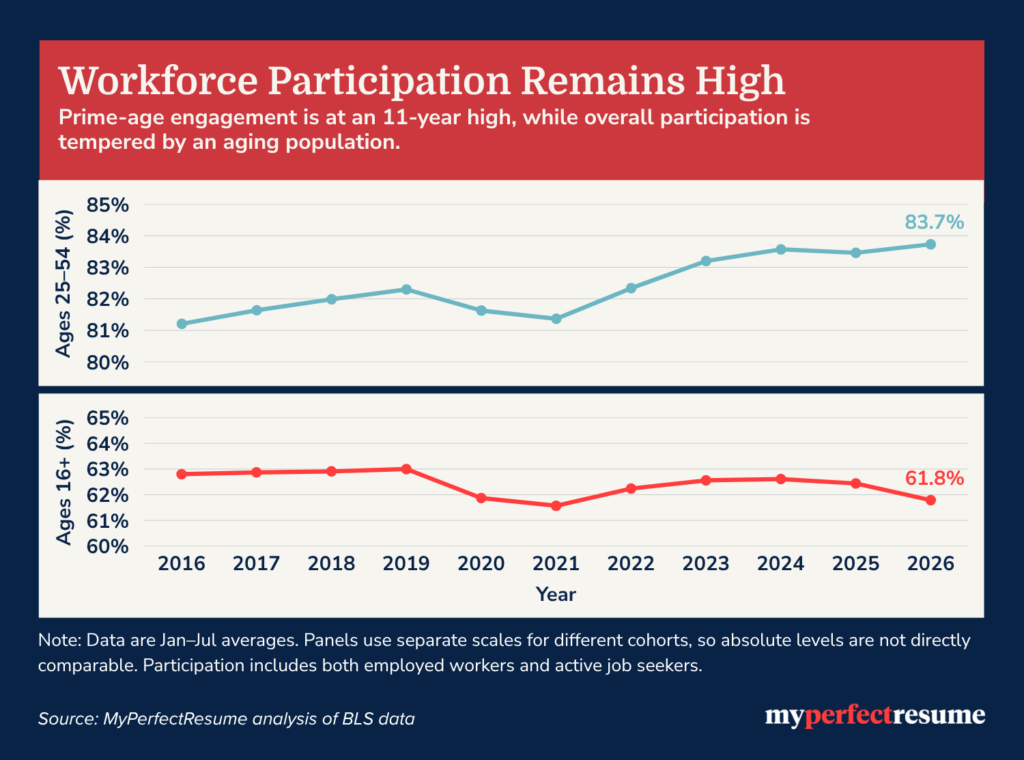
The distinction matters. Falling participation overall doesn’t, by itself, show that adults in their main working years are giving up on employment. Participation includes both people working and people seeking work; it doesn’t measure job hunting alone.
The Deterioration Isn’t Concentrated Among the Youngest Workers
Among the age groups shown below, adults ages 25 to 34 experienced the largest increase in unemployment since 2019.
| Group (Jan–Jul Average) | 2019 | 2023 | 2026 | Change Since 2019 |
| Ages 25–34 | 3.8% | 3.9% | 4.7% | +1 points |
| Ages 25–54 | 3.1% | 3.1% | 3.7% | +0.6 points |
| Ages 20–24 | 6.9% | 6.4% | 7.1% | +0.2 points |
| Bachelor’s degree or higher, 25+ | 2.2% | 2% | 2.8% | +0.6 points |
Unemployment among adults 25 to 34 rose 1 percentage point above its 2019 level, to 4.7%. Workers aged 20 to 24 still had a higher rate overall, at 7.1%, but their increase since 2019 was far smaller, and their rate improved between 2025 and 2026.
Unemployment among adults 25 and older with at least a bachelor’s degree reached 2.8%, the highest January-to-July average in the study outside 2020 and 2021.
These measures show how common unemployment is within each group, rather than how long it lasts. They shouldn’t be read as evidence about unemployment duration for particular age or education groups. The age categories also don’t specifically identify recent graduates.
Why Employed Workers May Be Reluctant to Leave
The quits rate is at an 11-year low, raising a question the federal data cannot answer: Why are so few people leaving jobs voluntarily? MyPerfectResume’s recent surveys offer some context.
Many want to leave but feel unable to act. In the Great Stay Report, 54% had considered leaving their employer in the past year. Yet 45% said they wanted to leave but felt unable to act, citing fear, job market concerns, or a need for stability. Only 9% were actively planning to leave, and 65% had no plans to look for a new job in 2026.
Changing jobs feels financially risky. In the Job-Hopping Report, 56% said changing jobs carried more financial risk than it did three to five years earlier. Nearly half (49%) saw staying put as the safest way to protect their income; 19% saw job-hopping as the best way to earn more.
These surveys asked people who currently hold jobs, while the federal data measures people who are unemployed. They describe the same labor market but not the same group of people, and the figures are reported side by side, not combined.
Savings Offer a Limited Cushion
In the Quit Tomorrow Test, 45% of surveyed workers said their savings would last less than 3 months without income, 30% said 3–11 months, and 25% said a year or more.
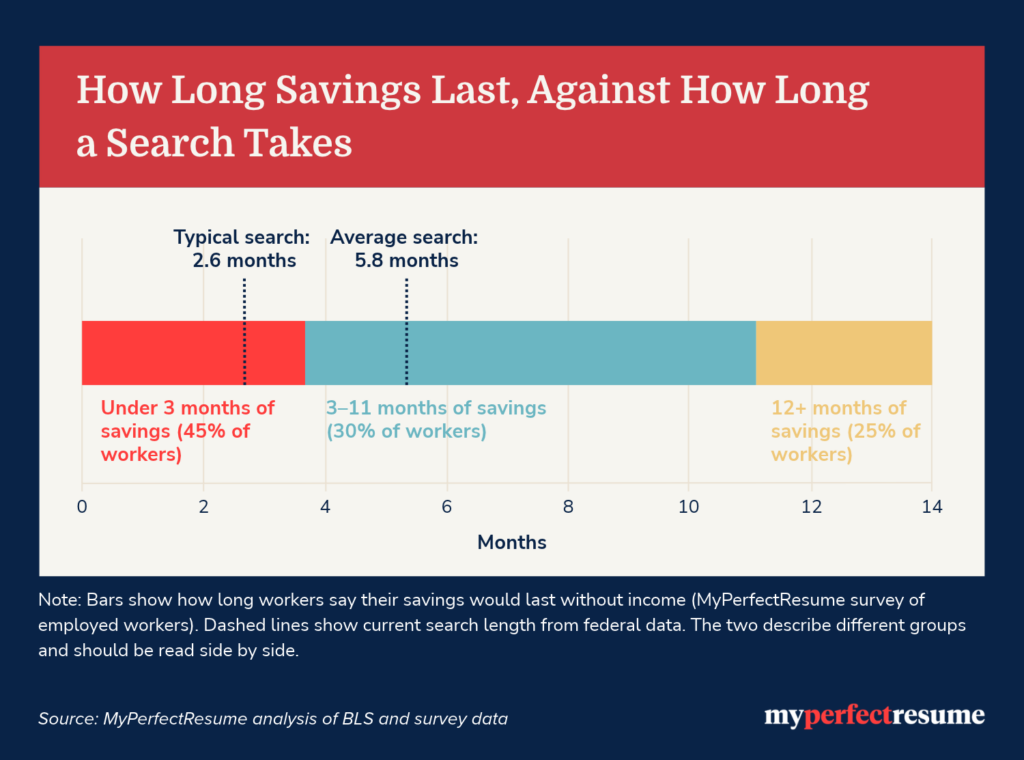
The unemployment figures in this chart measure time already spent unemployed, rather than completed job search timelines. The savings figures come from a separate survey of employed workers. The comparison illustrates potential financial pressure but can’t show how many unemployed people have exhausted their savings.
The Shift Behind the Headline Unemployment Rate
Between 2023 and 2026, the unemployment rate rose 0.7 percentage points. Over the same period, the share of unemployed people who were long-term unemployed rose 7 percentage points. Those measures answer different questions: how widespread unemployment is, and how much of it has become long-term.
Difficulty finding enough work also affected people who already had jobs. On average, 4.7 million Americans worked part-time for economic reasons, including reduced hours or an inability to find full-time work.
The broader underemployment measure, known as U-6, includes these workers, unemployed people, and people who want and are available for work and searched in the past year but not in the past four weeks. It averaged 8%, compared with a headline unemployment rate of 4.3%.
Together, these findings show why layoffs and the headline unemployment rate don’t capture every aspect of a difficult job market. The report’s central finding is the rise in prolonged unemployment: A growing share of unemployed Americans remain out of work for at least 27 weeks.
For press inquiries, contact Nathan Barber, nathan.barber@bold.com.
Methodology
MyPerfectResume analyzed 23 seasonally adjusted monthly datasets from the U.S. Bureau of Labor Statistics covering January 2016 through July 2026. Eighteen come from the Current Population Survey, the household survey of roughly 60,000 households used to calculate the monthly unemployment rate. Five come from the Job Openings and Labor Turnover Survey, a separate employer survey that measures hiring, quits, layoffs, and open positions.
Annual comparisons use January through July averages, so each year covers the same 7-month window. This keeps 2026, a partial year, comparable to complete years. Individual monthly readings are identified as such wherever they appear. Averages are simple unweighted means of the monthly values, calculated at full precision and rounded only for display. October 2025 is absent from the household survey data and was left blank rather than estimated; it falls outside the January through July window and affects no figure in this article. The JOLTS data is complete for that month, because it surveys employers rather than households.
Differences between two rates are reported in percentage points, never as a percent change. Percentage changes apply only to counts of people and lengths of time. All BLS figures are subject to revision, including annual seasonal adjustment updates that can alter historical values.
Comparisons in this article use 2023, which is the low point for several of these measures. Because the baseline choice affects the size of an increase, we also tested the central finding against other years. The long-term unemployed count is 68.3% above 2023, 46.4% above 2019, and 32% above 2022. The increase was present across all three comparisons.
Unemployment & Duration ▾
- Unemployment rate (LNS14000000)
- Total unemployed plus marginally attached plus part-time for economic reasons, as a percent of the labor force plus marginally attached, or U-6 (LNS13327709)
- Number unemployed 27 weeks and over (LNS13008636)
- Of total unemployed, percent unemployed 27 weeks and over (LNS13025703)
- Average weeks unemployed (LNS13008275)
- Median weeks unemployed (LNS13008276)
People Outside the Unemployment Count ▾
Unemployment by Education & Age ▾
- Unemployment rate, bachelor’s degree and higher, 25 years and over (LNS14027662)
- Unemployment rate, 25–34 years (LNS14000089)
- Unemployment rate, 25–54 years (LNS14000060)
- Unemployment rate, 20–24 years (LNS14000036)
- Unemployment rate, 16–24 years (LNS14024887)
- Unemployment rate, 16–19 years (LNS14000012)
Participation & Employment ▾
- Labor force participation rate (LNS11300000)
- Labor force participation rate, 25 to 54 years (LNS11300060)
- Employment-population ratio (LNS12300000)
Employer Hiring & Turnover (JOLTS) ▾
- Hires rate, total nonfarm (JTS000000000000000HIR)
- Hires level, total nonfarm (JTSHIL)
- Quits rate, total nonfarm (JTSQUR)
- Layoffs and discharges rate, total nonfarm (JTSLDR)
- Job openings rate, total nonfarm (JTSJOR)
Supporting BLS Sources ▾
- The Employment Situation, used to cross-check the most recent monthly readings against the published release.
- Table A-12, unemployed persons by duration of unemployment, the published table behind the long-term unemployment share.
- Current Population Survey concepts and definitions, the source for the definitions of discouraged workers, marginally attached workers, and part-time for economic reasons.
- Series were retrieved from data.bls.gov and the Federal Reserve Bank of St. Louis FRED database, which republishes BLS series without altering them. All figures cite the BLS as the original source.
This analysis doesn’t measure how people move into and out of unemployment; it doesn’t establish that weak hiring caused longer unemployment; and it doesn’t measure unemployment duration by education or age group.
Survey findings come from separate MyPerfectResume studies of U.S. workers, the Great Stay Report (published December 2025) and the Job-Hopping Report (released June 2026), each linked where cited in the article. Unlike the federal data above, which measures unemployment, these surveys asked about people who currently hold jobs. The two are reported side by side and are never combined into a single figure.
Rate this article

Jasmine is a certified career coach and recognized expert in job search strategy. She is committed to helping job seekers navigate the job market and succeed in their careers.
More Articles by Jasmine EscaleraShare this page
 Add MyPerfectResume as a preferred source on Google
Add
Our customers have been hired at:*Foot Note