Our customers have been hired at: *Foot Note
Table of Contents
Get started with MyPerfectResume today!
- Build a resume on any device
- Pick an ATS-friendly template
- Tailor with AI copy suggestions
The American economy has undergone a significant transformation since the Great Recession. From Wall Street’s collapse to a global pandemic to today’s AI-driven workplaces, workers and businesses have had to adapt to constant disruption. Through all this upheaval, one factor has quietly reshaped the map of economic opportunity: productivity.
Across the country, some states have leveraged technology, innovation, and emerging industries to enhance the value each worker produces per hour. Others have struggled to keep pace, with productivity barely rising in nearly two decades.
These uneven gains highlight a widening divide between states that are building resilient, future-ready economies and those at risk of being left behind.
Key Findings

- Washington (+66%) leads all states in long-run productivity growth (2007–2024).
- North Dakota (+61%), California (+51%), Nebraska (+46%), and Colorado (+44%) round out the top five.
- Louisiana (+5%) and Wyoming (+6%) sit at the bottom, with minimal long-term gains.
- Regional performance is uneven: the West stands out for the strongest cumulative gains, while the Northeast, Midwest, and South show steadier gains, but more minor improvements.
- Top 2023 to 2024 movers include Indiana (+6%), which led year-over-year growth, followed by Rhode Island (+5%) and Washington (+5%).
Why This Metric Matters
Labor productivity = real output ÷ hours worked.
When productivity rises, it means workers are producing more value for each hour on the job, often due to improved technology, capital, skills, or organizational efficiency.
It’s a lens on efficiency, not just employment levels. Sustained productivity growth is closely linked to wage growth and improvements in living standards over time.
Where Productivity Surged (2007–2024)
Not all states have shared equally in the productivity boom. Over the last 17 years, some economies have transformed into engines of efficiency, while others have made only modest progress. The contrast shows how industry mix, demographics, and investment shape long-term growth.
Top 10 states by long-run growth
These are the states where workers are producing dramatically more output per hour than in 2007:
- Washington (+66%)
- North Dakota (+61%)
- California (+51%)
- Nebraska (+46%)
- Colorado (+44%)
- Utah (+43%)
- Oregon (+40%)
- Massachusetts (+38%)
- Kansas (+37%)
- Virginia (+37%)
States Falling Behind
On the other end of the spectrum are the states that have seen little to no improvement in nearly two decades.
These laggards often rely on volatile sectors (such as energy and tourism) or slower-moving industries (like traditional finance or extraction) that have not benefited from significant efficiency gains.
Bottom 10 states by long-run growth (2007–2024)
These are the states where workers and businesses have not been able to keep up:
- Louisiana (+5%)
- Connecticut (+8%)
- Nevada (+13%)
- Delaware (+13%)
- Alaska (+16%)
- Hawaii (+17%)
- Mississippi (+18%)
- Wisconsin (+19%)
- Arizona (+20%)
- Rhode Island (+20%)
The Latest Shake-Up: 2023 to 2024 Momentum
The short-term momentum gives a different perspective:
- Indiana leads the way with a 6% increase, driven by efficiency gains in manufacturing.
- Rhode Island (+5%) and Washington (+5%) show strong recovery and tech-led momentum.
- States like New Hampshire, Maine, California, and North Carolina bucked the prolonged heatwave with steady growth (approximately +4%).
- Conversely, Nebraska, Alabama, Vermont, Maryland, and Wyoming experienced essentially flat growth.
These year-over-year shifts help identify which economies are on the move right now and which might be hitting the ceiling.
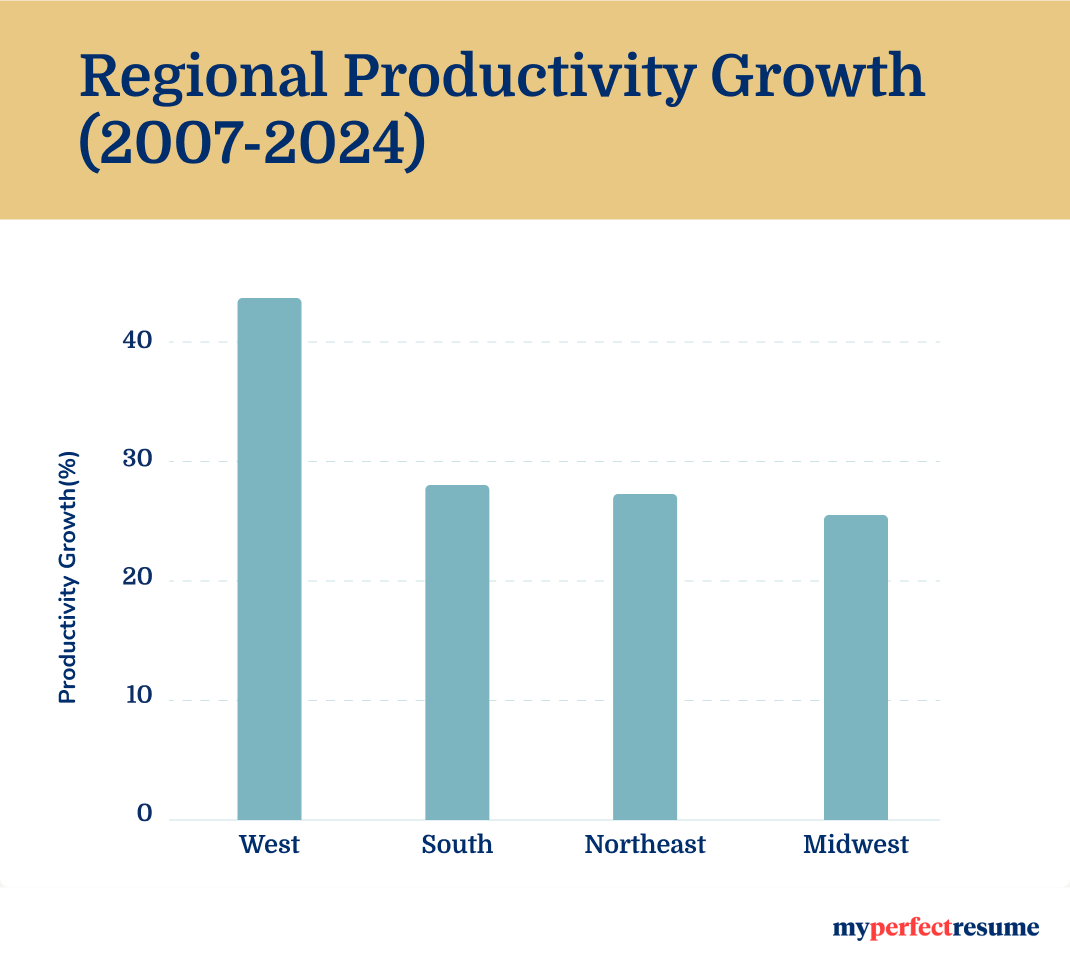
Regional Trends
A regional pattern emerges from the data:
- West (+44%): Consistently leads, powered by tech and innovation clusters
- South (+28%): Moderate gains driven by manufacturing and energy sectors
- Northeast (+27%): Stable, fueled by finance and higher education, but slower overall growth
- Midwest (+25%): Leaning on traditional manufacturing, which improved but less dramatically
Here is a visual representation of the data from above:
State-by-State Productivity Growth (2007–2024)
While regional patterns tell part of the story, looking at individual states reveals the sharpest contrasts in long-term productivity gains.
From Washington’s 66% surge to Louisiana’s 5% crawl, the map of growth highlights how industry mix, workforce skills, and investment shape outcomes.
The table below ranks all 50 states by cumulative labor productivity growth since 2007:
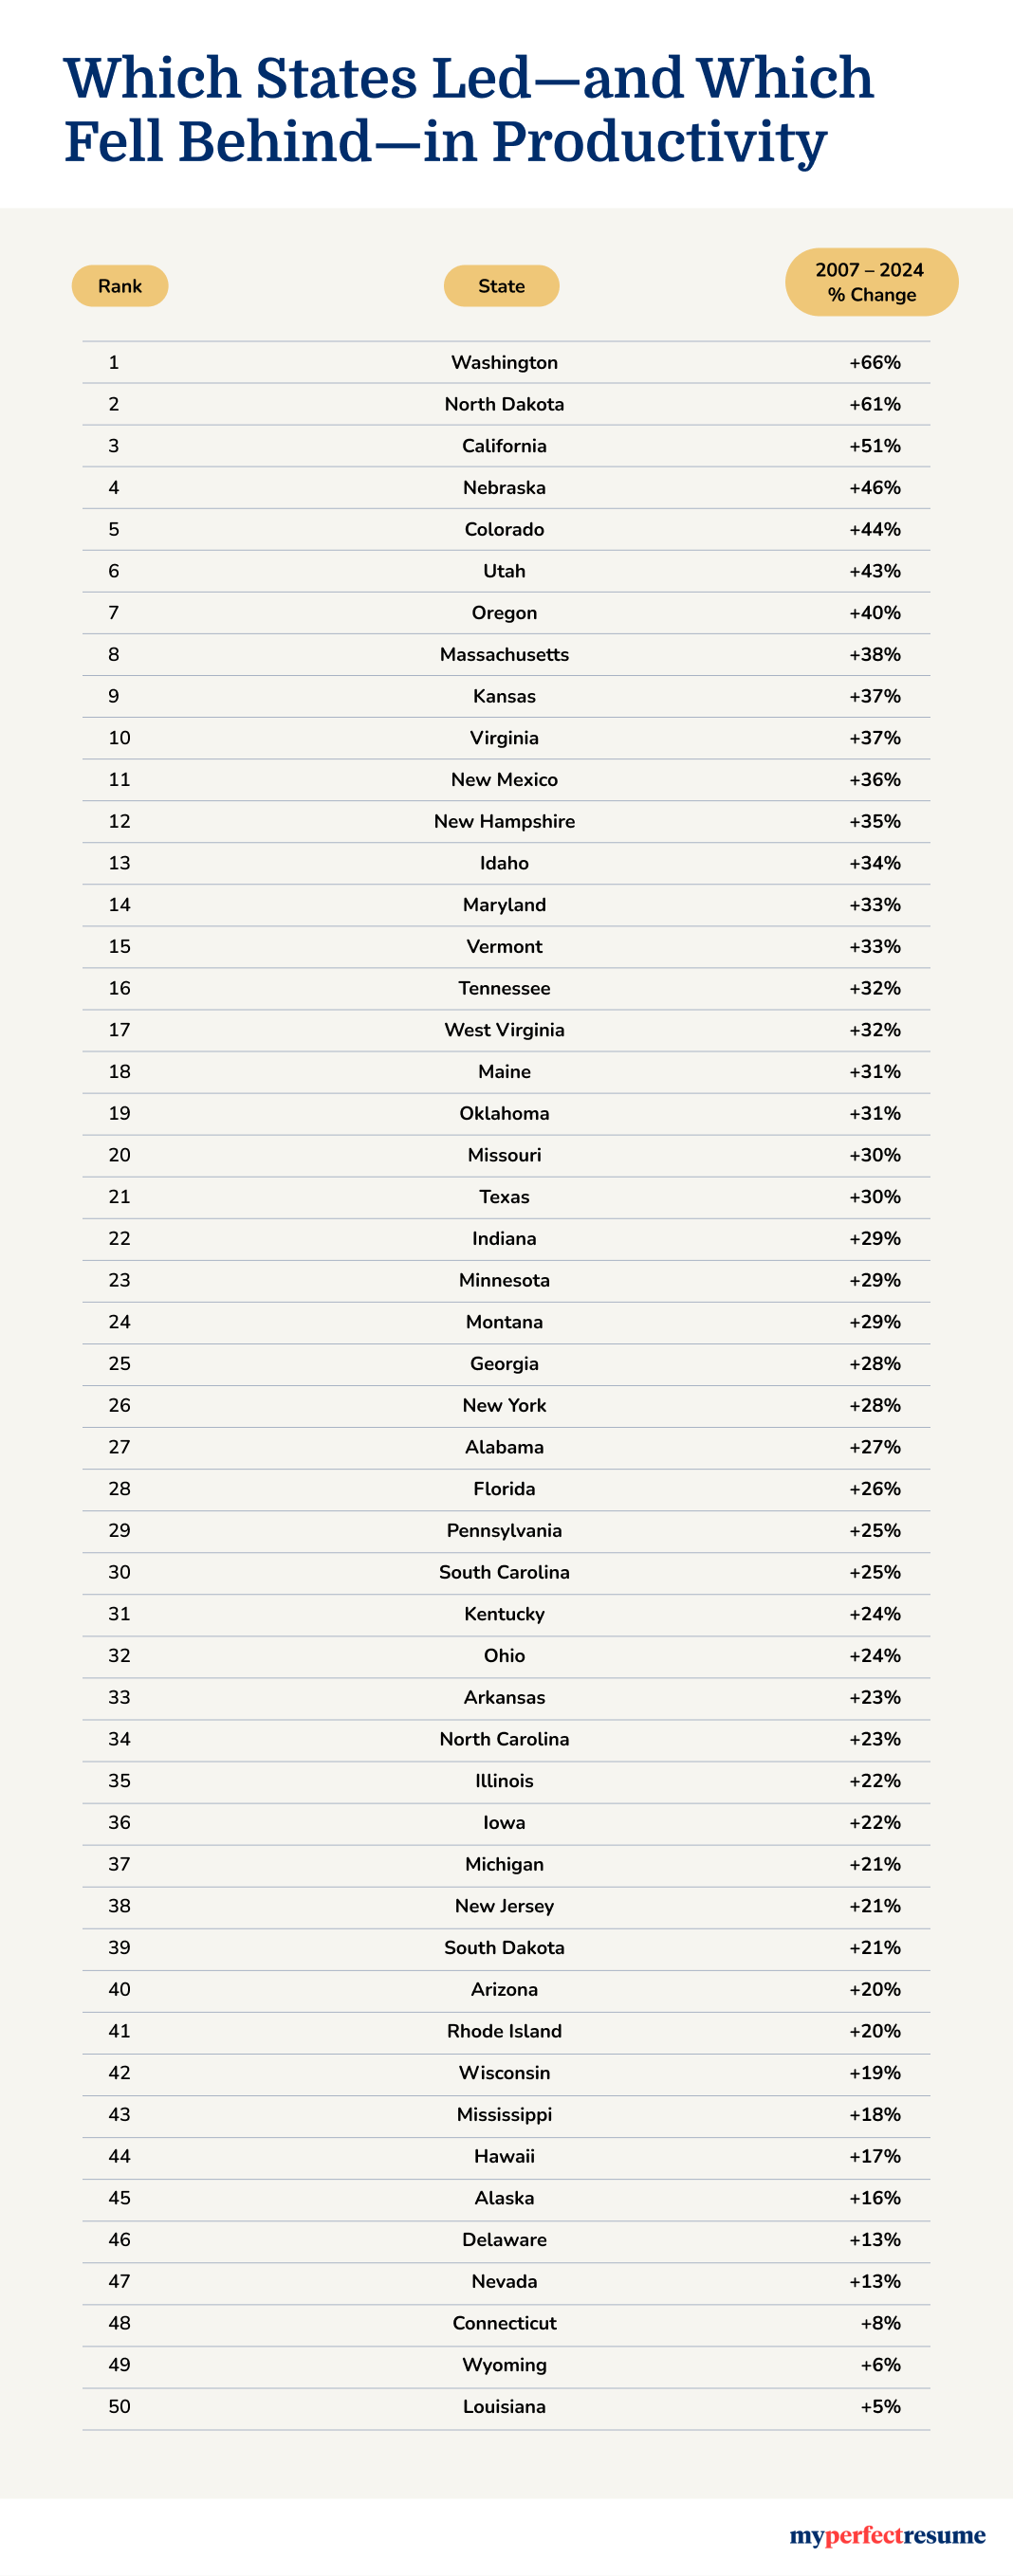
This ranking makes clear which states have become leaders in efficiency and innovation and which are at risk of falling behind in a more competitive national economy.
What It Means for Workers and Employers
- Similarly to workers in the best states for jobs, those in high-productivity states often see richer opportunities and faster-growing wages over time.
- Employers that invest in technology, training, and process improvement are better positioned to sustain productivity gains without pushing workers into burnout.
- States that diversify their industry bases and invest more in human capital are more likely to close the gap with leading regions.
Methodology
This analysis was conducted by MyPerfectResume using publicly available data from the U.S. Bureau of Labor Statistics (BLS).
- Source: BLS State Productivity program. Figures reflect labor productivity (output per hour).
- Construction: State-level productivity is calculated by combining real GDP by state (produced by the Bureau of Economic Analysis) with state-level hours worked from the BLS. This allows BLS to derive an output-per-hour index for each state. The methodology is described in detail in the Monthly Labor Review and related BLS documentation.
- Indexing: Productivity figures are presented as indices (base period = 100). Percent changes reflect cumulative growth since 2007, as well as one-year changes between 2023 and 2024. BLS commonly uses a benchmark base year (e.g., 2017 = 100) for consistency, although the exact base period depends on the table or chart being referenced.
- Scope: These measures capture the efficiency of labor in each state economy. They do not represent the average hours worked by individuals, but rather the aggregate relationship between total state output and total hours worked by the state.
About MyPerfectResume
MyPerfectResume Resume Builder with professional templates is designed to help job seekers elevate their careers. The easy-to-use platform was created to eliminate the hassle of resume writing, offering professionally written examples, free expert tips, step-by-step guidance to make a resume, and valuable interview advice to create an outstanding job application effortlessly. Since 2012, MyPerfectResume’s Resume Builder has helped more than 11 million job seekers create their perfect resumes online. Its comprehensive employment surveys have been featured in Forbes, Yahoo! Finance, CNBC, Newsweek, USA Today, BBC, Workable, and more. Stay connected with MyPerfectResume’s latest Facebook, LinkedIn, Instagram, X, and Pinterest updates.
Rate this article
Labor Productivity by State

Jasmine is a certified career coach and recognized expert in job search strategy. She is committed to helping job seekers navigate the job market and succeed in their careers.
More Articles by Jasmine EscaleraShare this page
Our customers have been hired at:*Foot Note