Editors’ Picks
Career Education

Career Planning • 9 min read
Top 10 Reasons for Leaving a Job & How To Explain Them
Leaving a job is a significant decision that often sparks thoughtful reflection about personal growth, job satisfaction, and future career goals. The reasons for this transition can range from seeking better
Elizabeth Muenzen, CPRW • May 21, 2025
Career Planning • 10 min read
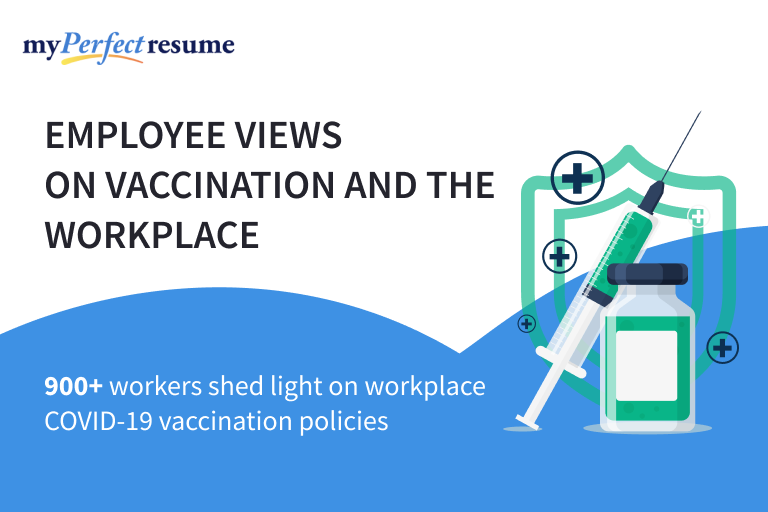
Opinions on Vaccination & Employment
Welcome to the jungle—the third year of the global COVID-19 pandemic. Meet Tom, a typical corporate employee who was one of the first to be vaccinated against coronavirus in his workplace. Now,
Kellie Hanna • Jan 07, 2025
Ready to take the next step in your career?
Our expert advice will help you craft the perfect resume or cover letter. Showcase your unique skills and qualifications to stand out to employers and get hired faster.

