Editors’ Picks
How To Write a Resume: A Complete Guide
You need a resume, and you need it fast. But with only seconds to make a strong first impression on hiring managers, how can you ensure your resume stands out? In
How to Fix & Update Your Resume in 2025
Your resume is one of the most important tools in your job search. It’s your chance to make a great first impression on potential employers and show them why you’re
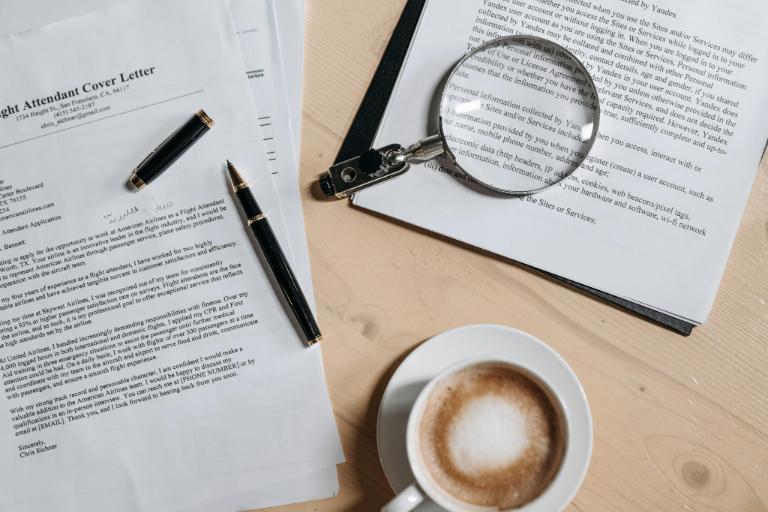
How to Write a Cover Letter: Examples for Popular Jobs
A good cover letter is crucial to making a strong first impression and standing out from the competition. It’s a chance to present yourself in more detail and showcase your
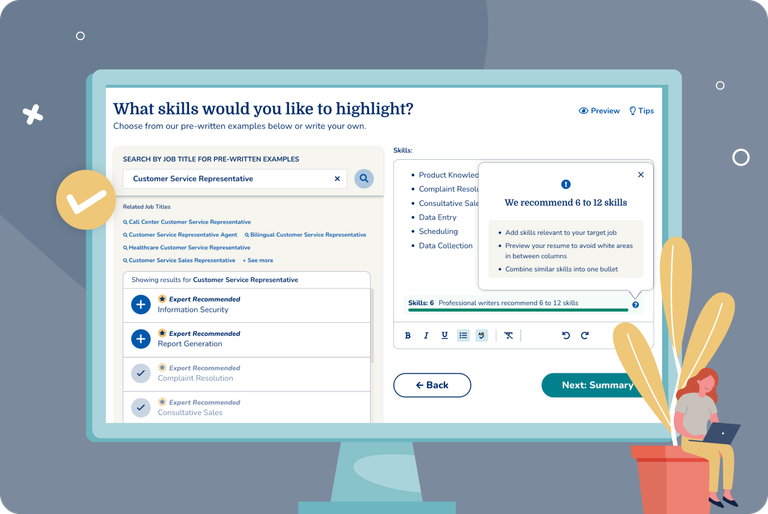
AI Resume Skills Generator
Take the guesswork out of building your skills section with our AI resume skills generator. Our latest technology instantly creates a list of skills tailored to your desired role. If you
Most Recent
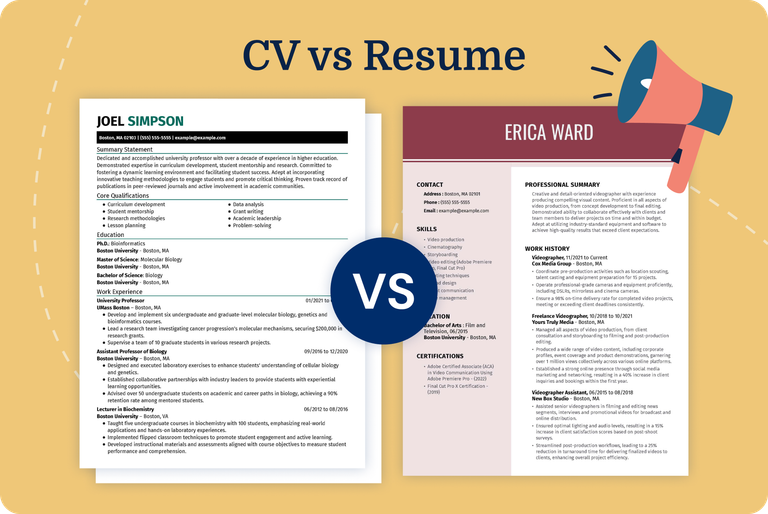
CV vs Resume: What’s The Difference?
Confused about the difference between a CV vs a resume? You’re not alone! While both help you land a job, they’re quite different. In this quick guide, we’ll break down what

Unlocking Your Potential: Resume & Career Guide for People With Disabilities
Navigating the job market as a person with a disability can feel overwhelming, but it can also be an empowering process when you know your rights, understand your marketable strengths,
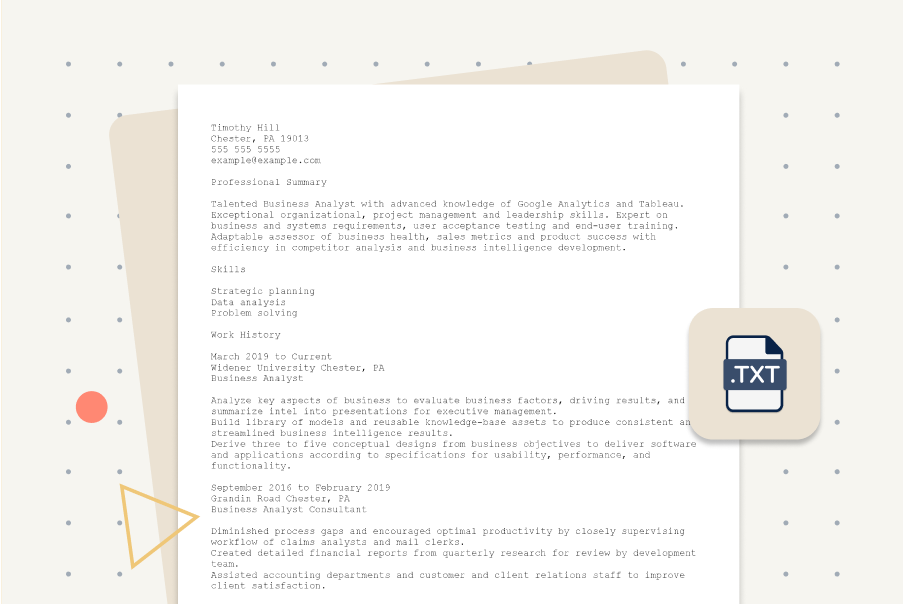
Plain Text Resume Templates & Examples: Free Download
It’s always a good idea to have a plain text resume saved and ready — you never know what type of job application you will come across. Our step-by-step advice
Categories
Resumes
Craft the perfect resume to showcase your skills and experience. Get tips and examples for a standout resume.

Cover Letters
Write compelling cover letters that grab employers’ attention. Learn how to highlight your strengths effectively.
Interviews
Ace your interviews with our interview question and answer advice. Prepare for general questions and make a lasting impression.
Jobs
Explore job opportunities and find your career fit. Get guidance on job searching and applications.


Resumes
130+ Hobbies to List on a Resume (Examples & Guide)
When it comes to crafting a standout resume, most job seekers focus on professional experience, education, and skills. But there’s one often-overlooked section that can offer valuable insight into who
10 Best AI Resume Builders (Tested & Reviewed)


Get noticed with a polished cover letter
Use our cover letter examples as inspiration to write a perfect cover letter. Our Cover Letter Builder will guide you through each section of your cover letter and provide expert phrases you can include in just a few clicks.


Cover Letters

How to End a Cover Letter (Examples & Tips)
The final paragraph of your cover letter is more than just a formality — it’s a chance to reiterate your enthusiasm for the role and encourage the hiring manager to
Cover Letter Introduction: Examples & Writing Guide
A well-crafted cover letter introduction is essential for grabbing the hiring manager’s attention and setting the stage for your job application. Sounds like a mighty job for a few sentences! In

How to Start a Cover Letter: Expert Strategies to Stand Out
The opening lines of your cover letter are crucial for capturing the hiring manager’s attention and setting the tone for the rest of your application. In this guide, we’ll offer creative
Interviews
Cashier Interview Questions and Answers
Securing a cashier interview means your resume and cover letter stood out in the customer service industry. Now, impress the hiring manager with your skills. Face-to-face interviews are crucial in
How to Use the PAR Method: Complete Guide (With Examples)
Acing a job interview is about providing thoughtful and concise answers showcasing precisely what makes you the right candidate for the role. How can you ensure your answers hit the
Frequently Asked Dental Assistant Interview Questions & Answers
When interviewing for a dental assistant role, it’s essential to prepare for questions that assess both your technical knowledge and your ability to provide excellent patient care. In this guide, we’ll
HR Administrative Assistant Interview Questions & Answers
Job interviews can be stressful, even for an experienced HR administrative assistant. How you tackle each answer shows an employer what type of candidate you are. We can help you create
Frequently Asked Communications Specialist Interview Questions & Answers
Preparing for a job interview for a corporate communication specialist position is crucial. With the right planning, you can ace the interview and land the job of your dreams. Preparation means
Answers: What Does Good Customer Service Mean to You?
If you are applying for a customer service position, you will likely be asked, “What does good customer service mean to you” during your job interview.In this guide, we’ll offer
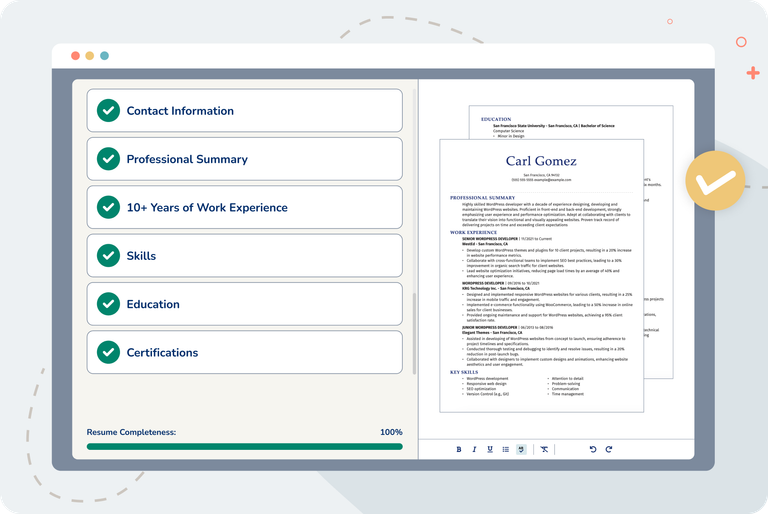
Build the perfect resume for the job you want.
Our free-to-use resume builder will help you easily create the perfect resume. We provide step-by-step writing advice and a resume check to fix common grammar and spelling mistakes.
Jobs

How to Convert Your Federal Resume for the Private Sector
The ongoing wave of federal layoffs has left many government employees facing a time-sensitive need to transition into private-sector roles. One of the key adjustments in this transition is adapting a

How to Find a Recruiter to Fast-Track Your Job Search
Looking for a recruiter to fast-track your job search? The right recruiter can connect you with top jobs and help market your skills and qualifications to potential employers. But how do

Top 15 Companies for Remote Work-From-Anywhere Jobs
The demand for location-independent careers continues to grow as more professionals seek alternatives to traditional office work. Whether working from a rural hometown or traveling as a digital nomad, remote jobs
Careers
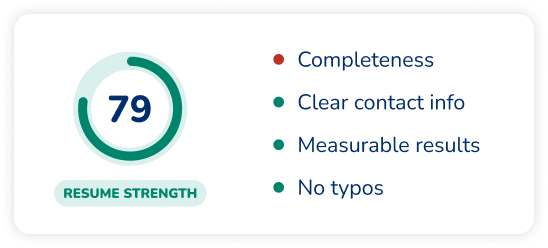
79% of Employers Are Slowing Hiring in 2025—And Rethinking Resume Norms
The job market is entering a new era of caution, flexibility, and AI-driven decisions. According to a new MyPerfectResume survey of 918 U.S. HR professionals, employers are pulling back on

9 in 10 Teachers Consider Quitting in 2025: The Hidden Cost of Passion
As schools across the U.S. struggle to retain educators, new data from MyPerfectResume reveals a profession at a breaking point. In a March 2025 survey of 800 K–12 teachers, 58%
Top Resume and CV Examples
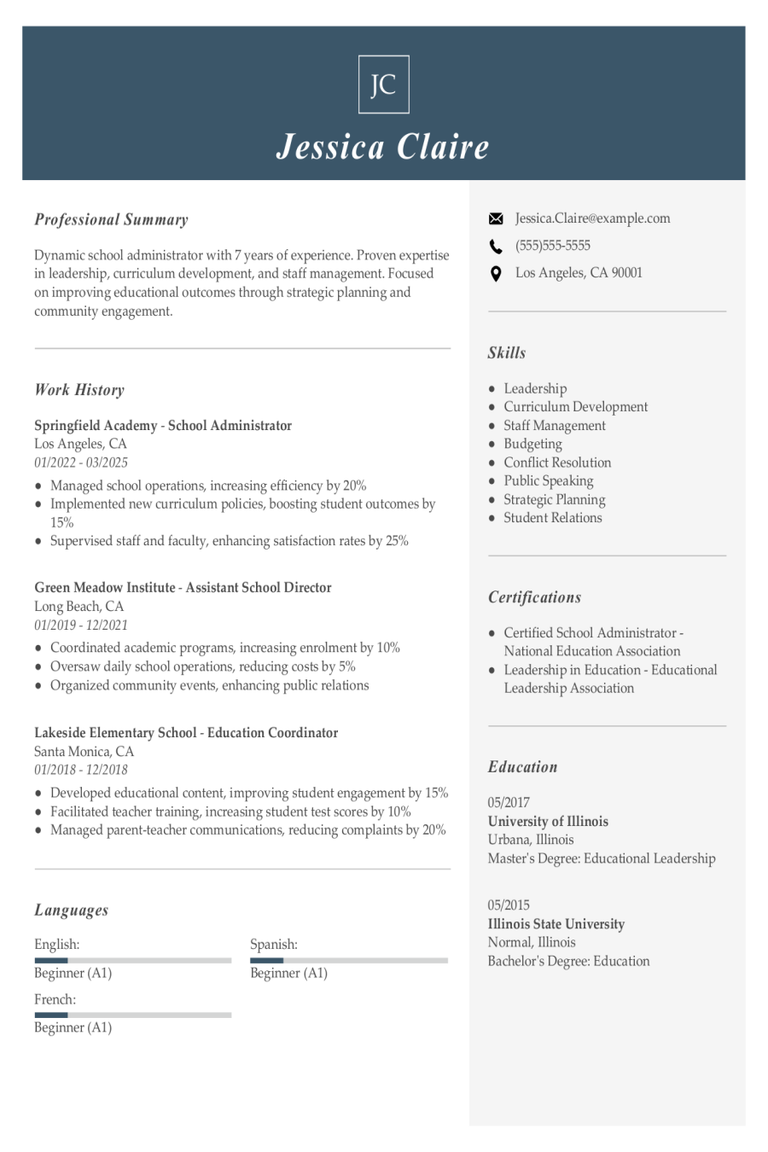
School Administrator Resume Examples & Templates
Explore school administrator resume examples to learn how to highlight your leadership skills and experience with staff supervision and school operations.Build my resumeImport existing resumeCustomize this templateWhy this resume worksQuantifies

Dean of Students Resume Examples & Templates
A dean of students oversees administration and academic processes for students at high schools, colleges and universities. This job’s responsibilities include addressing everything from admissions, financial aid and health services

School Superintendent Resume Examples & Templates
A superintendent is a top school district executive who oversees day-to-day operations, including the management of educational programs and facilities. Superintendents supervise staff, manage educational policies, organize board meetings and

Special Education Teacher Cover Letter Examples & Templates
Special education teachers are compassionate and highly trained professionals who help students with physical, emotional or developmental needs thrive in a school environment. A strong special education teacher cover letter

Sales Executive Cover Letter Example & Templates
Start by editing this sample cover letter for a sales executive or explore our 250+ cover letter examples to find the best match for you.
Principal Cover Letter Example & Templates
As shown in the free principal cover letter sample, a cover letter should be three or four paragraphs that convince the hiring manager to contact you for an interview. The

Library Assistant Cover Letter Example & Templates
Start by editing this library assistant cover example, or explore our collection of more than 250 cover letter examples to find the best match for you.

Graduate Assistant Cover Letter Example & Templates
Start by editing this graduate assistant cover example, or explore our collection of more than 250 cover letter examples to find the best match for you.

Executive Director Cover Letter Example & Templates
When you write your version of this free executive director cover letter sample, there are some important things to keep in mind. First, keep it short and to the point.

Case Manager Cover Letter Example & Templates
The strength or weakness of your cover letter may determine whether or not you are considered for a job position. In order to receive an interview, it can be important
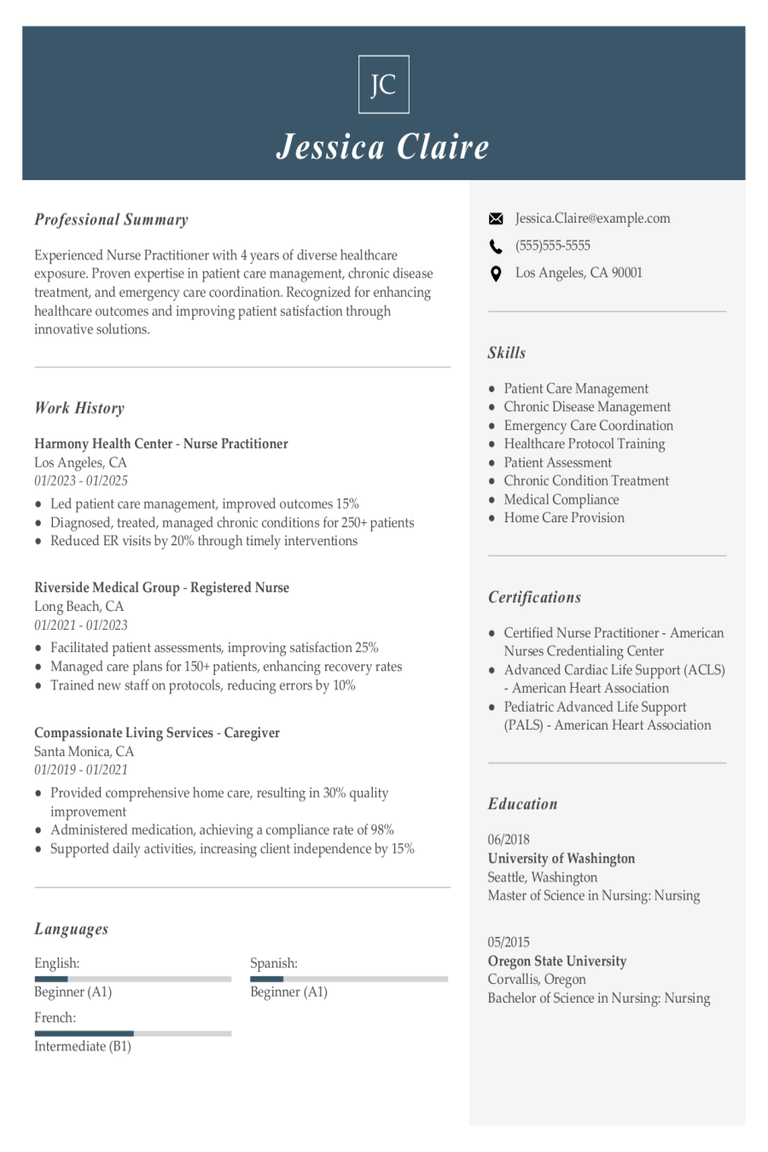
Nurse Practitioner Resume Examples & Templates
Explore nurse practitioner resume examples that showcase how to highlight your clinical experience, advanced nursing skills, and patient care expertise.Build my resumeImport existing resumeCustomize this templateWhy this resume worksQuantifies accomplishments: Includes


Engineer Resume Examples & Templates
There are many types of engineering careers, and they all have one thing in common: building and creating things, from bridges and dams to machines, textiles and prosthetic limbs. The

Medical Doctor Resume Examples & Templates
Entry-level
Accounting Manager Resume Examples & Templates for 2025
Accounting managers play a critical role in managing the financial operations of a company or organization. They ensure that financial records are accurate, budgets are handled efficiently, and compliance with
Best Nursing Assistant Resume Examples + Guide & Pro Tips
Explore nursing assistant resume examples and writing tips to learn how to highlight your hands-on experience and patient care skills effectively.Build my resumeImport existing resumeCustomize this templateWhy this resume worksHighlights

Operating Room Registered Nurse & Templates
An operating room registered nurse is one of those professions that is easy to identify thanks to its constant portrayal in movies and television shows. But there is a great

Administrative Assistant Cover Letter Examples & Templates
Administrative assistants are indispensable for the success of any organization. Whether handling documents, managing schedules, answering phones and emails or interacting with clients, their support is invaluable. When paired with

Executive Assistant Cover Letter Examples & Templates
Start by editing this sample cover letter for an executive assistant or explore our cover letter templates to find the best match for you.

Data Entry Specialist Cover Letter Examples & Templates
Start by editing this cover letter sample for a data entry specialist or explore our cover letter templates to find the best match for you.

Director Cover Letter Example & Templates
Directors lead companies and advance businesses to the next level. They are the bosses–the ones who make the important decisions. They must be able to complete the following tasks:Assigning tasks Assessing

Bartender Cover Letter Example & Templates
A well-written bartender cover letter can help you differentiate yourself from the competition. Along with a well-written resume, highlighting your exceptional interpersonal skills and problem-solving skills will give you an
Executive Assistant Resume Examples & Templates
Browse executive assistant resume examples to see how to showcase strengths like managing schedules and coordinating meetings. Get expert writing tips to create a resume that reflects your experience and
Actor Resume: Example & Tips
Discover acting resume examples that help you share your talents and experience. We’ll show you how to showcase your roles, skills, and training in a way that catches attention and
Registered Nurse Resume Examples & Templates
Explore top registered nurse resume examples that showcase your essential clinical skills. Learn how to effectively present your patient care experience and medical expertise to impress healthcare employers.Build my resumeImport

Nursing Aide Resume Examples & Templates
You need a great resume if you want a job as a nursing aide, so we’re here to help you build one. Our guide to crafting an effective resume for
Customer Service Representative Resume Examples & Templates
Explore customer service representative resume examples to learn how to highlight your communication skills, problem-solving abilities, and customer-focused experience. Browse expert tips to create a resume that stands out.Build my
Personal Trainer Resume Examples & Templates
See how a strong personal trainer resume highlights your fitness expertise. These examples will help you showcase key skills like client programming, coaching, and motivation to stand out.Build my resumeImport
Teacher Resume Examples & Templates
Explore a variety of teacher resume examples that demonstrate how to organize your resume, highlight essential teaching skills, and showcase your classroom experience.Build my resumeImport existing resumeCustomize this templateWhy this

Information Technology Resume Examples & Templates
Information technology (IT) professionals perform a wide range of tasks related to managing and maintaining computer systems, networks and software. Get expert tips on how to write a resume that

Best Law Enforcement Resume Examples & Templates
Your community connections, law knowledge and commitment to protection can help you pursue a career in law enforcement. Time to write a resume to stand out from the applicant pool. We’re

Retail Resume Examples & Templates
Retail service professionals play a vital role in delivering excellent customer service, driving sales and maintaining a retail store’s overall operations. Discover how to write a resume that highlights your customer
Healthcare Support Cover Letter Examples & Templates
Healthcare support provides assistance to doctors and nurses while providing emotional support to patients and their families. Your role is as much technical as it is interpersonal. An efficient healthcare